

概要
当大学の人口健康研究部門は、研究、報告、視覚的コミュニケーションを支援するためにGISデータを使用しています。大判GIS出力の作成は、特に断続的な使用時に乾燥や期限切れの可能性がある消耗品(カートリッジなど)の継続的な費用とライフサイクル制限を含む、 大判プリンターの総所有コスト によって歴史的に制約されてきました。
このケーススタディは、GISレイヤーをベクタープロットに変換し、ペンプロッターを使って物理的な出力を作成する代替ワークフローを記録しています。このワークフローは、 標準的な報告用プリント(A4) および A1までの縮尺地図製品を、専門的な大判印刷機器に依存せずにサポートします。
状況と研究の制約
大判GISビジュアライゼーションは、以下のような学術環境で運用が難しいことがあります:
- プリンターの取得および保守コスト は高く、断続的またはプロジェクトベースの使用には正当化が難しいです。
- 消耗品は劣化する可能性があります (乾燥・期限切れ)、特に大判印刷が連続的でない場合に廃棄物や予測不可能性を生み出します。
- 各反復にコストがかかるため、探索的なビジュアルデザインや迅速な改良が抑制されます。
これらの制約に対処するために、断続的な研究サイクルにより適した手法としてペンプロッティングを検討しました: ペンは安価で交換が容易、かつ広く入手可能であり、さまざまな用紙サイズで高品質なベクター線画を生成できます。
なぜペンプロッターが実用的な代替手段なのか
ペンプロッターは、コストとワークフローの動態をいくつかの有用な方法で変えます:
- 消耗品リスクの低減と補充の簡素化: ペンは交換が簡単で、断続的に使用されるインクシステムに典型的な「乾燥したカートリッジ」という故障モードがありません。
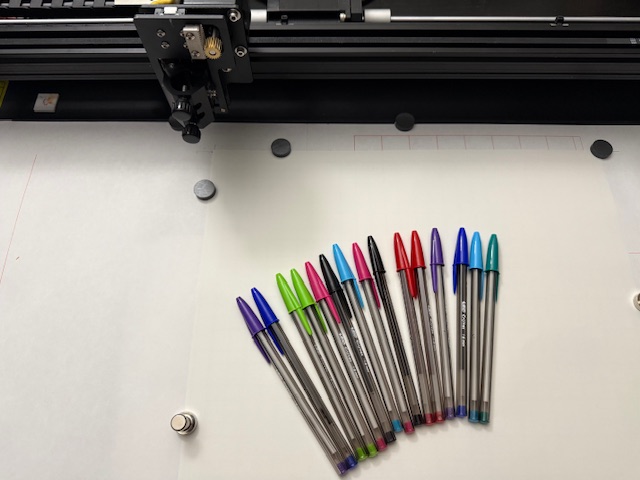
- より高い視覚的柔軟性: 幅広い ペンの太さ、色、インクの種類 を使って、レイヤーごと(道路、公園、ポイント、境界線)の視認性を調整できます。
- コントラストとアクセシビリティのオプション: 異なる 用紙の色 をペンやマーカーと組み合わせてコントラストを向上させることができます(例:明るい色の用紙に濃い線画、または濃い色の用紙にジェルペンやペイントペンを使用)、テーマレイヤーの識別をより明確にサポートします。
- スケーラブルな出力フォーマット: 同じベクターワークフローは 報告書のA4挿入用 にも使用でき、ポスターや展示、大規模なレビューセッションには A1 に拡大可能です。
機器とセットアップの考慮事項
- プロッター: UUNA TEK 3.0 A1ペンプロッター
- 対応出力サイズ: A1までの任意のカスタムサイズ
- 主な使用例: レイヤー化されたGIS由来のベクタープロット(線画および点の特徴)
配送と取り扱いに関する所見
UUNA TEK 3.0 A1は重くしっかりと作られています。輸送中に損傷がありましたが、問題の詳細をUUNA TEKに連絡したところ、迅速に交換部品が送られてきました。運用面では、迅速なサポートによりダウンタイムが短縮され、研究スケジュール内での実装が可能になりました。
ビルド品質(展開時の考慮点)
レール、モーター、ベルトは頑丈です。ユニットは自分で動かして位置調整できますが、その重量とサイズのためにサポートが必要なユーザーもいるかもしれません。
ソフトウェア環境とワークフロー
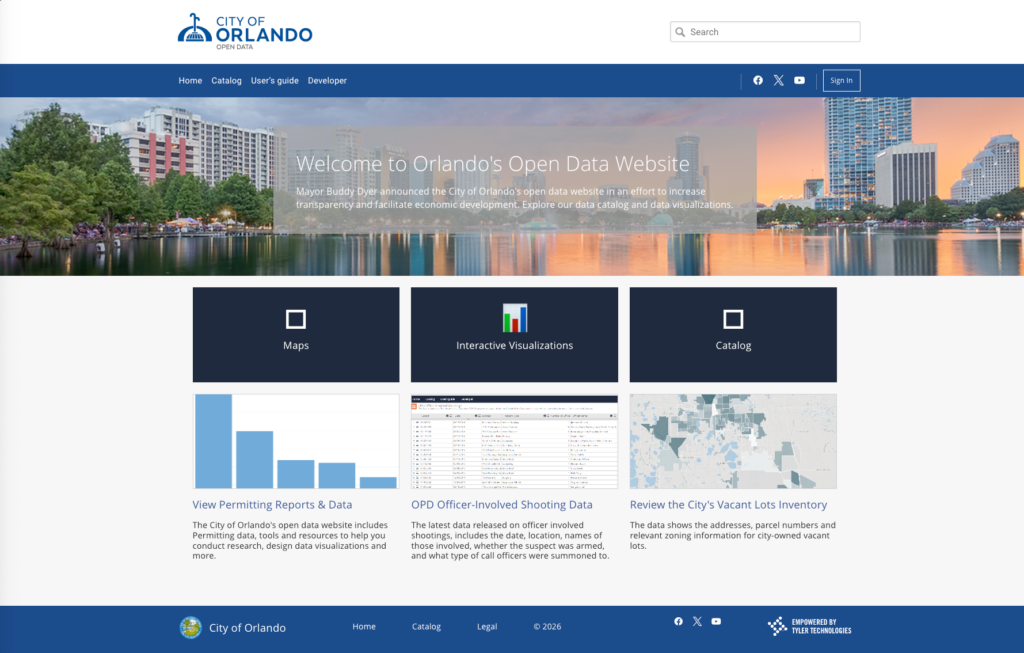
- データソース: オーランド市GISオープンデータハブ(GeoJSON)
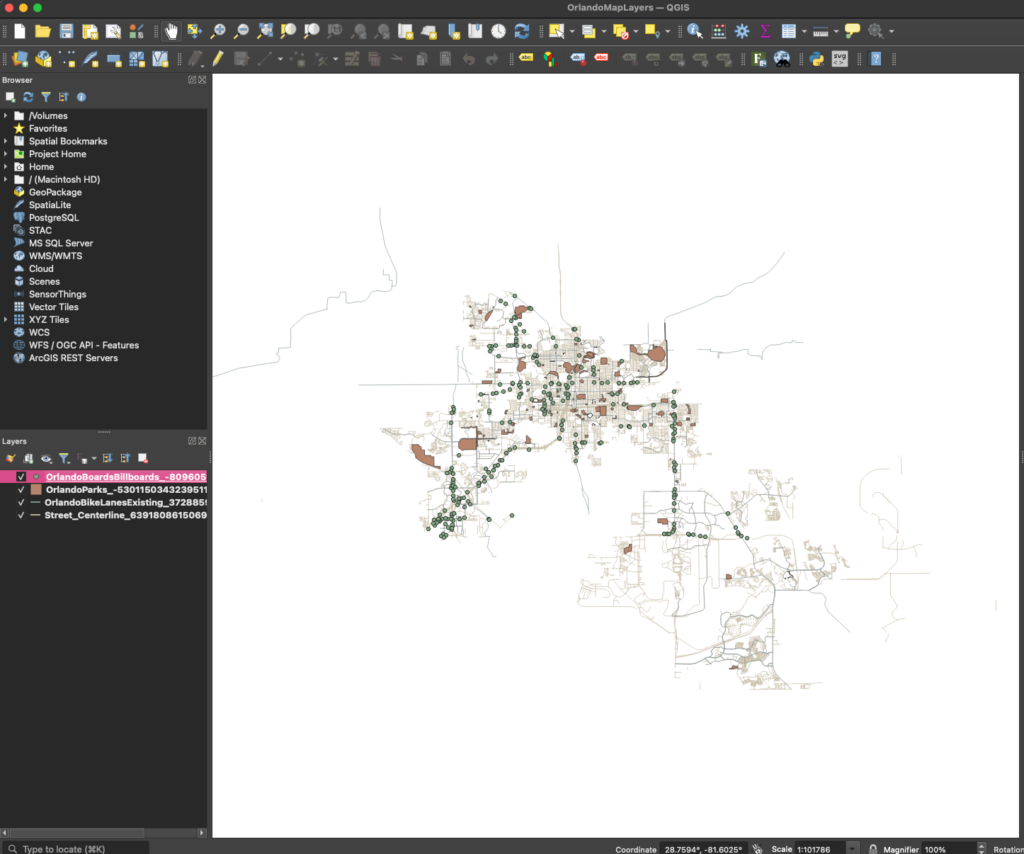
- GISソフトウェア: QGIS(レイヤー設定とSVGエクスポート)
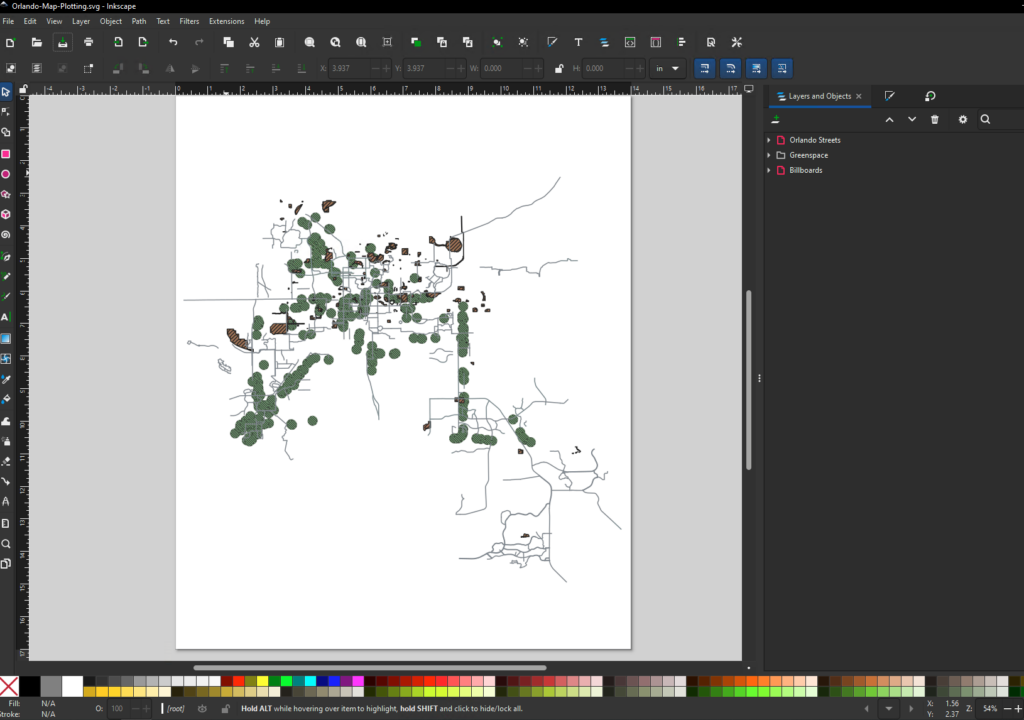
- ベクター編集/整列: Inkscape(クリーンアップ、グループ化、位置合わせ/整列)(ベクター作成とクリーンアップにはAdobe Illustratorも使用)
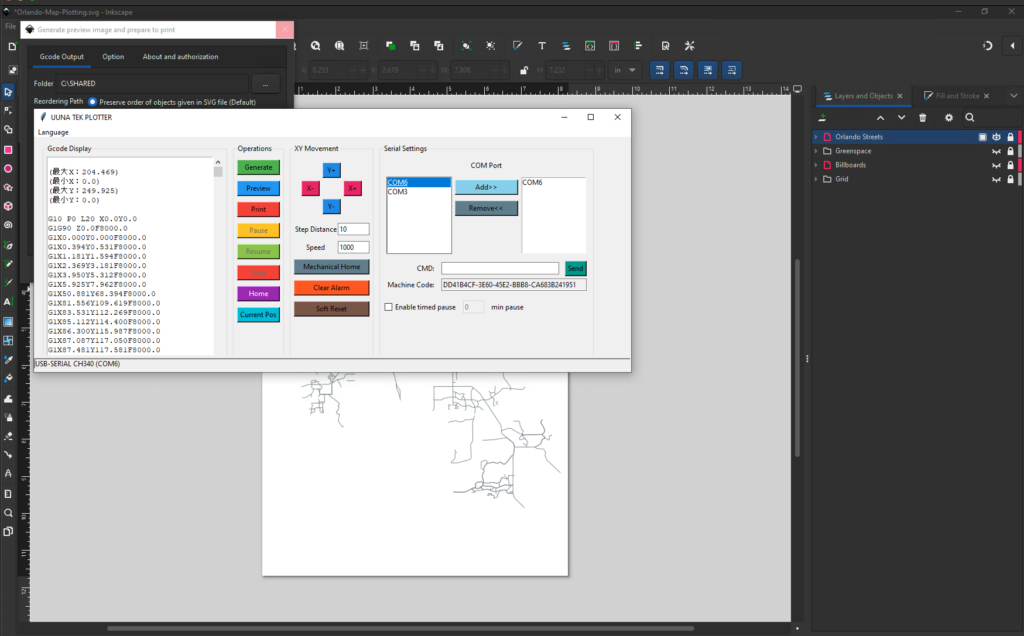
- プロッター制御: UUNA TEKソフトウェアとチュートリアル(位置合わせ、アクティベーション、設定)、Inkscape(UUNA拡張機能付き)
UUNA TEKのチュートリアル動画は初期設定とワークフローの理解に役立ちました。macOSユーザーとして、ソフトウェアの互換性や設定に関する質問はUUNA TEKのサポートにも頼りました。UUNA TEKのソフトウェアとInkscape拡張機能はMac OSとWindows PCの両プラットフォームで利用可能です。
データ準備とプロット手法
このワークフローは、各GISテーマを独立したベクターレイヤーとして扱い、それぞれを個別にプロットしてから位置合わせで組み合わせることで、用紙サイズを問わず繰り返し使用できるように設計されています。
1) GISデータを取得
私は オーランド市のオープンデータハブからGeoJSONデータセットをダウンロードしました。この初期テストでは以下を使用しました:
- 道路
- 公園
- ビルボードの位置
(私たちの広範な研究目標は、開発が緑地に与える影響を可視化することです。その作業は将来の投稿で文書化されます。)
2) QGISでレイヤーを整理
- 新しいQGISプロジェクトを作成します。
- 各GeoJSONデータセットをQGISに読み込みます。
- 各データセットを独自のレイヤーに割り当て、ターゲット出力に合わせてスタイルや配置を調整します。
3) 各レイヤーをSVGにエクスポート(レイヤーごとに1ファイル)
マルチペンプロットをサポートし、下流の複雑さを減らすために:
- QGISで新しい印刷レイアウトを作成し、マップオブジェクトを挿入します。
- 1つのレイヤー以外はすべて非表示にします。
- 表示されているレイヤーを SVGとしてエクスポートします。
- 残りの各レイヤーについて繰り返します。
これにより、分離されたベクターファイルが生成され、順次プロット(通常はレイヤーごとに1本のペン)され、 A1までの任意のカスタムサイズで一貫してスケーリングできます。
4) Inkscapeで位置合わせと登録を準備
- 各SVGをInkscapeにインポートします。
- 各レイヤーのオブジェクトを整理してグループ化します。
- すべてのレイヤーを一つの親グループにまとめて、一貫した変換を維持します。
- 事前に作成した A1サイズのSVGグリッドテンプレート を位置合わせの基準として使用し、グループ化された出力を整列・スケーリングします。
そのグリッドテンプレートは一貫した位置合わせシステムとして機能します:紙は既知の座標領域に置かれ、アートワークは一致するようにスケーリング・配置されます—最大A1サイズまで対応。
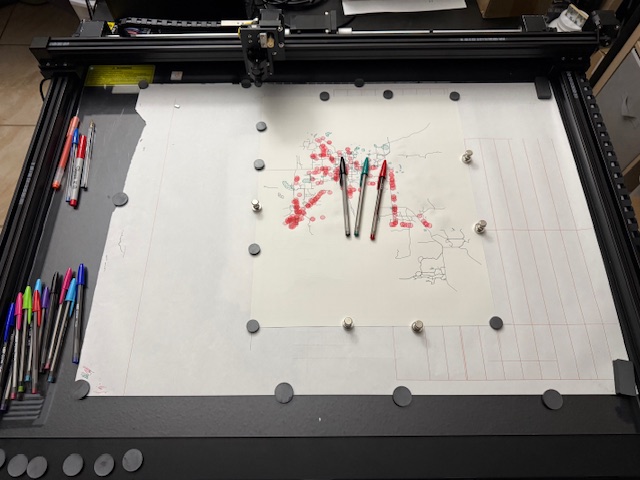
5) レイヤーごとにプロット(マルチペンワークフロー)
- 最初のペンで最初のレイヤーをプロットします。
- ペンを交換し、テーマごとに太さや色を変えて順番にレイヤーをプロットします。
- コントラストが重要な場合は、ペンの選択と 紙の色 を組み合わせて、読みやすさとレイヤーの分離を向上させます。
予備結果(初期A4出力)
初期テストは14x17インチの出力を使用して迅速な反復をサポートし、最終的なグラフィックがレポートや配布資料にきれいに統合されることを確認しました。レイヤーワークフロー(レイヤーごとにQGISからエクスポートし、Inkscapeで整列し、順次プロット)は実用的で再現可能であることが証明されました。
観察事項と制限事項
-
研究ビジュアライゼーションにおける強み
- ペンの太さと色の選択により、明確で高品質な線画と強いテーマの分離を実現。
- 大判プリンターと消耗品の維持に比べて、断続的な使用時の運用摩擦が低い。
- レポート挿入用(A4)および大判プレゼンテーションフォーマット(最大A1)の両方に対応。
-
ワークフローの制限
- QGISとInkscape間でGISデータを移動する際には学習曲線があり、時折フォーマットの摩擦点が生じます。
- 塗りつぶされた領域(例:公園・緑地)は、データに忠実でありながら面の特徴をどのように表現するか(ハッチング、密度、マーカーフィル)について追加の判断が必要です。
-
運用上の注意点
- ベンダーのサポートは迅速かつ効果的であり、大学環境での導入において展開までの時間が重要な場合に関連性があります。
次の段階:A1出力へのスケーリング
次の段階では、同じ手法を A1までの大判フォーマット に適用し、面塗り戦略(例えば、ハッチングの密度、マーカーの使い方、スケールでの判読性)を洗練させます。続編の記事では以下を記録します:
- 大判サイズでの用紙取り扱いと位置合わせの実践。
- A1サイズでのプロット時間の考慮。
- 基礎となるGISデータと一貫性があり読みやすい面塗り技術。
主なポイント
さまざまな用紙サイズでGISのビジュアルが必要な研究チームにとって、ペンプロッターは大判プリンターの代替手段となり得ます。特に主な制約が コスト、メンテナンス、消耗品のリスクである場合に有効です。ペンは 線の太さ、色、スタイルを柔軟にコントロールでき、インクの選択と 用紙の色 を組み合わせることで、コントラストや読みやすさの選択肢が広がります。GISとベクターツール間の移行には学習曲線があり(面塗りには追加の技術が必要ですが)、この方法は大判印刷のインフラ負担なしに反復的で再現可能、かつ拡張可能な研究ビジュアライゼーションをサポートします。
このケーススタディは、2026年1月7日にニコラス・アルピンによって寄稿されました。元の記事はこちらです。